📄 Introduction
Ready to take your Teacher Assistant app to the next level? Imagine not just managing student records, but also tracking attendance, grades, and generating reports — all within the same sleek desktop app built in Rust.
After laying the groundwork in Level 1 with a login system and student CRUD, Level 2 takes your app further by introducing attendance tracking, grade management, and report generation — all within a clean, scrollable, and interactive interface powered by egui.
Here’s what makes Level 2 exciting:
- ✅ Extended student details — add attendance, grades, and more to each student.
- ✅ Tabbed interface — navigate effortlessly between Students, Attendance, Grades, Reports, and Teacher Info.
- ✅ Interactive dashboards and panels — intuitive buttons, scrollable tables, and visually simple layouts.
- ✅ Foundation for future enhancements — prepare your app for multi-teacher support, cloud sync, and advanced analytics in Level 3.
By the end of this tutorial, you’ll have a powerful, GUI-based Teacher Assistant app that’s more than a database — it’s a full classroom companion, ready for real-world usage.
Before diving into the code, let’s review the key Rust, egui, and GUI concepts you’ll need to make this project shine.
🔖 Key Concepts in Level 2
In Level 2, you’ll master Rust GUI essentials while extending your app:
- Tabbed sub-panels — navigate Attendance, Grades, Reports, and Teacher Info effortlessly.
- Dynamic state — switch tabs and update views in response to user actions.
- Rich student data — record attendance, grades, and additional details for each student.
- Scrollable tables — neatly display information for easy access.
- Interactive UI elements — buttons, forms, and inputs that respond smoothly.
With these concepts in hand, we’re ready to explore the login screen and dashboard before diving into building each panel with Rust and egui.
📌 See the App in Action
The snippets below focus on the key logic behind each panel. For the full, ready-to-run Level 2 project, check out the complete source code on GitHub Gist - and try it out yourself!
Note: The Login panel and Student CRUD operations remain the same as Level 1
⚠️ Version Check
Before diving into the panels, make sure your Cargo.toml contains the correct dependency versions for egui, eframe, egui_extras, and egui_plot.
All these crates should be on the same version (e.g., 0.32) to avoid version mismatch errors.
✅ Tip: If you see unexpected compile errors, double-check the versions in
Cargo.toml— mismatches across egui-related crates are a common cause.
💡 Note: The egui_plot crate is currently at version 0.33, but it is built against egui = "0.32". This is expected — just ensure the rest of your egui ecosystem (eframe, egui_extras) stays within the 0.32.x series.
[package]
name = "TA_level2"
version = "0.1.0"
edition = "2021"

[dependencies]
eframe = "0.32.3"
csv = "1.1"
egui_extras = "0.32.3"
egui_plot = "0.33"
chrono = "0.4"
📚 Dashboard Panel
In level 2, the dashboard panel now includes dedicated buttons for Student Details sub-panel, Attendance, Grades, Reports and Teacher Info.
DashboardState::Main => {
 if ui.add(egui::Button::new(egui::RichText::new("Student Details").size(15.0).strong().colo(egui::Color32::DARK_BLUE),).min_size(egui::Vec2 { x: (200.0), y: (50.0) })).clicked(){
    self.state = DashboardState::StudentDetails;
 }
 ui.add_space(20.0);

 if ui.add(egui::Button::new(egui::RichText::new("Attendance").size(15.0).strong().color(egui::Color32::DARK_BLUE),).min_size(egui::Vec2 { x: (200.0), y: (50.0) })).clicked() {
     self.state = DashboardState::Attendance;
 }
 ui.add_space(20.0);

  if ui.add(egui::Button::new(egui::RichText::new("Grades").size(15.0).strong().color(egui::Color32::DARK_BLUE),).min_size(egui::Vec2 { x: (200.0), y: (50.0) })).clicked(){
    self.state = DashboardState::Grades;
 }
 ui.add_space(20.0);

 if ui.add(egui::Button::new(egui::RichText::new("Reports").size(15.0).strong().color(egui::Color32::DARK_BLUE),).min_size(egui::Vec2 { x: (200.0), y: (50.0) })).clicked(){
    self.state = DashboardState::Reports;
 }
 ui.add_space(20.0);

 if ui.add(egui::Button::new(egui::RichText::new("Teacher Info").size(15.0).strong().color(egui::Color32::DARK_BLUE),).min_size(egui::Vec2 { x: (200.0), y: (50.0) })).clicked(){
    self.state = DashboardState::TeacherInfo;
 }
}
Screenshot: Dashboard panel showing buttons for Student Details, Attendance, Grades, Reports and Teacher Info buttons.
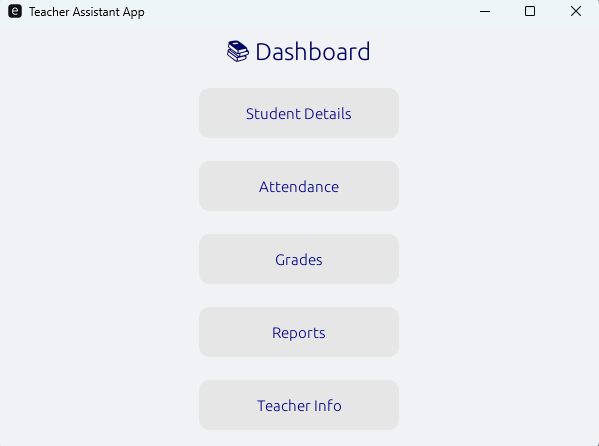
Click the image to view full size
🗃️ Student Details Panel
The Student Details panel provides buttons for adding, updating, deleting, and viewing student records.
StudentDetailsState::ButtonsPanel => {
    if ui.add(egui::Button::new(egui::RichText::new("Add a Student").size(15.0).strong().color(egui::Color32::DARK_BLUE),).min_size(egui::Vec2 { x: (200.0), y: (50.0) })).clicked(){
        self.student_details_state = StudentDetailsState::AddStudent;
    }
    ui.add_space(20.0);
    if ui.add(egui::Button::new(egui::RichText::new("Update Student Details").size(15.0).strong().color(egui::Color32::DARK_BLUE),).min_size(egui::Vec2 { x: (200.0), y: (50.0) })).clicked() {
        self.student_details_state = StudentDetailsState::UpdateStudent;
    }
    ui.add_space(20.0);
    if ui.add(egui::Button::new(egui::RichText::new("Delete Student").size(15.0).strong().color(egui::Color32::DARK_BLUE),).min_size(egui::Vec2 { x: (200.0), y: (50.0) })).clicked(){
       self.student_details_state = StudentDetailsState::DeleteStudent;
    }
    ui.add_space(20.0);
    if ui.add(egui::Button::new(egui::RichText::new("View Student").size(15.0).strong().color(egui::Color32::DARK_BLUE),).min_size(egui::Vec2 { x: (200.0), y: (50.0) })).clicked(){
        self.student_details_state = StudentDetailsState::ViewStudent;
    }
    ui.add_space(20.0);
    if ui.add(egui::Button::new(egui::RichText::new("Back").size(15.0).strong().color(egui::Color32::DARK_BLUE),).min_size(egui::Vec2 { x: (200.0), y: (50.0) })).clicked(){
        self.state = DashboardState::Main;
    }
}
Screenshot: Student Details panel showcasing Add, Delete, Update and View buttons.
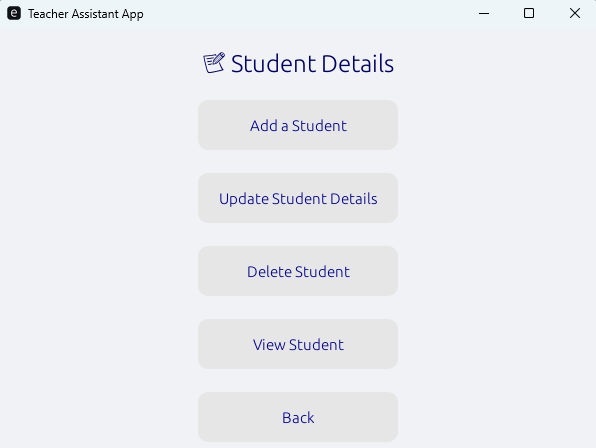
Click the image to view full size
Now, sleeves rolled up, let’s dive into the Attendance and Grades panels and see these interactive patterns in action.
📑 Attendance Panel
The Attendance panel lets you select the date, class, and section, then displays the list of students with checkboxes for Present and Absent.
for (i, roll_no, name, was_present) in &student_views {
  let mut is_present = was_present.unwrap_or(false);
  let mut is_absent = was_present.map(|v| !v).unwrap_or(false);

  body.row(25.0, |mut row| {
    row.col(|ui| { ui.label(roll_no); });
    row.col(|ui| { ui.label(name); });

    // Present checkbox
    row.col(|ui| {
        if ui.checkbox(&mut is_present, "").changed()
        {
            updates.push((*i, is_present));
        }
    });

    // Absent checkbox
    row.col(|ui| {
        if ui.checkbox(&mut is_absent, "").changed()
        {
            updates.push((*i, !is_absent));
        }
    });
  });
}
Screenshot: Attendance panel showing the selected date and list of students for the class.
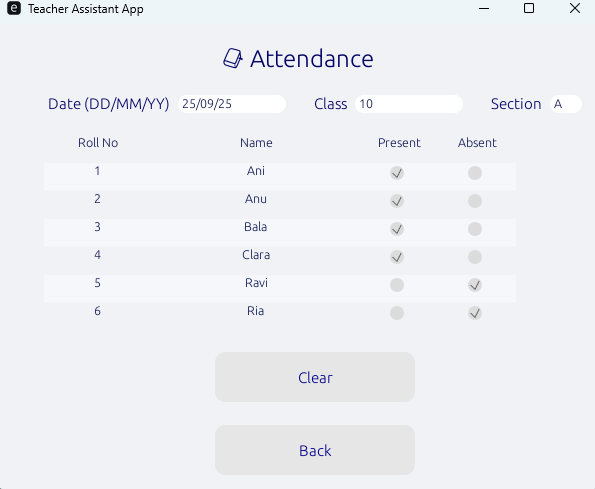
Click the image to view full size
🔢 Grades Panel
The Grades panel allows selecting a class and section from dropdowns, then displays the students in that group with input fields to enter their grades. In Level 2, only a single class and section exist, but this can be expanded in Level 3.
// 🔹 Select Class
ui.horizontal_top(|ui|{
let classes = self.get_available_classes();
if !classes.is_empty() {
if self.selected_class.is_empty() || !classes.contains(&self.selected_class) {
self.selected_class = classes[0].clone(); // default to first class
}
egui::ComboBox::from_label("Class")
.selected_text(&self.selected_class)
.show_ui(ui, |ui| {
for class_name in &classes {
ui.selectable_value(&mut self.selected_class, class_name.clone(), class_name);
}
});
}
// 🔹 Select Section
let sections = self.get_available_sections(&self.selected_class);
if !sections.is_empty() {
if self.selected_section.is_empty() || !sections.contains(&self.selected_section) {
self.selected_section = sections[0].clone(); // default to first section
}
egui::ComboBox::from_label("Section")
.selected_text(&self.selected_section)
.show_ui(ui, |ui| {
for section in §ions {
ui.selectable_value(&mut self.selected_section, section.clone(), section);
}
});
}});
// 🔹 Fetch matching students
let mut students: Vec<_> = self.students
.iter_mut()
.filter(|s| s.class_name == self.selected_class && s.section == self.selected_section)
.collect();
// Sort alphabetically
students.sort_by(|a, b| a.name.to_lowercase().cmp(&b.name.to_lowercase()));
if students.is_empty() {
ui.label(egui::RichText::new("No students found for this class and section.")
.italics()
.color(egui::Color32::GRAY),
);
return;
}
Screenshot: Grades panel listing students with input fields to enter grades.
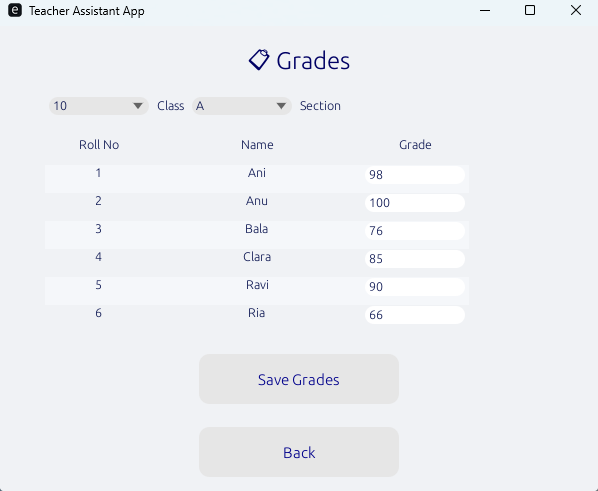
Click the image to view full size
With Attendance and Grades in place, it’s time to move forward and bring the Reports and Teacher Info panels to life.
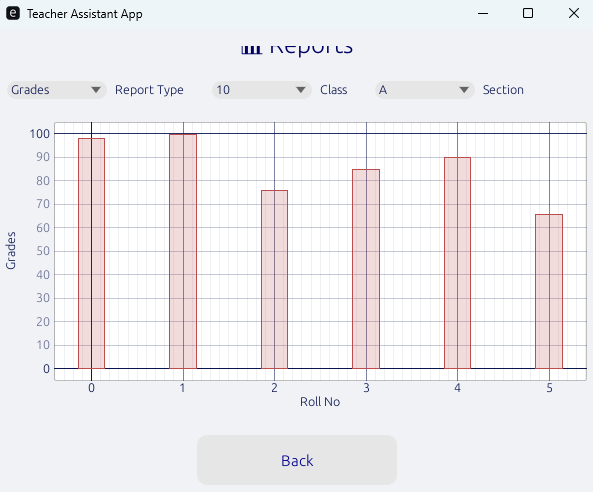
📊 Reports Panel
The Reports panel lets users select the report type, class, and section, and displays attendance and grades visually as bar graphs.
//Attendance report
{
    ui.label(egui::RichText::new("Attendance %").heading().color(egui::Color32::DARK_RED));
    let chart = BarChart::new("Attendance %" , bars).width(0.3);
    Plot::new("attendance_report")
        .view_aspect(2.0)
        .include_x(0.0)
        .include_y(100.0)
        .x_axis_label("Roll No")
        .y_axis_label("Attendance %")
        .allow_drag(false)
        .allow_scroll(false)
        .show(ui, |plot_ui| {
            plot_ui.bar_chart(chart);
        });
}
Screenshot: Reports panel displaying attendance and grades in graphical form.
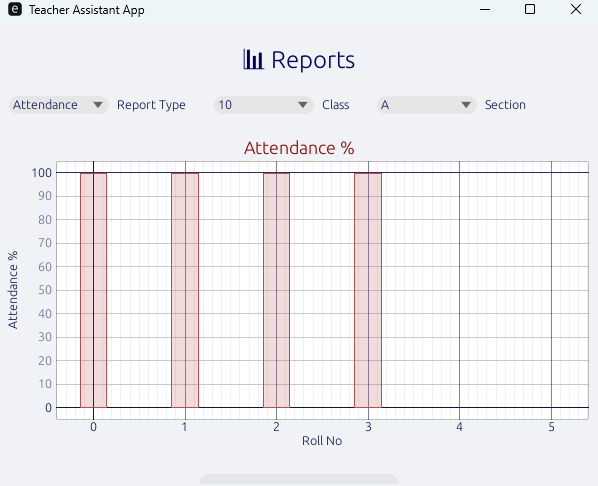
Click the image to view full size
Click the image to view full size
🪪 Teacher Info
This panel displays teacher information in a read-only format. In Level 2, only a single teacher’s info is shown.
egui::Frame::group(ui.style()).inner_margin(10.0).show(ui, |ui| {
    ui.horizontal(|ui| {
        // Photo or placeholder
        if let Some(photo) = photo_path {
            if let Ok(image) = load_image(photo, ctx) {
                ui.add(egui::Image::new(&image).fit_to_exact_size(egui::vec2(100.0, 100.0)));
            } else {
                ui.label("No Photo");
                ui.allocate_space(egui::vec2(100.0, 100.0));
            }
        } else {
            ui.label("No Photo");
            ui.allocate_space(egui::vec2(100.0, 100.0));
        }

        ui.add_space(20.0); // spacing between photo and text

        ui.vertical(|ui| {
            ui.label(egui::RichText::new(format!("Id: {}", staff_id)).heading().strong().size(15.0));
            ui.add_space(4.0);

            ui.label(egui::RichText::new(format!("Name: {}", staff_name)).heading().strong().size(15.0));
            ui.add_space(5.0);

            ui.label(egui::RichText::new(format!("Qualification: {}", qualification)).heading().strong().size(15.0));
            ui.add_space(5.0);

            ui.label(egui::RichText::new(format!("Subjects: {}", subjects)).heading().strong().size(15.0));
            ui.add_space(5.0);

            ui.label(egui::RichText::new(format!("Contact: {}", contact)).heading().strong().size(15.0));
            ui.add_space(5.0);

            ui.label(egui::RichText::new(format!("Email: {}", email)).strong().size(15.0));
        });
    });
});
Screenshot: Teacher Info panel showing the teacher’s details in a structured layout.
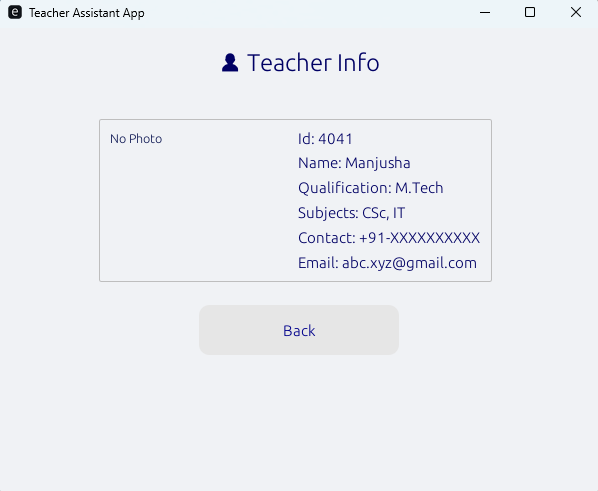
Click the image to view full size
With student data tracked and grades recorded, these panels let you visualize performance and view teacher information at a glance, rounding out the Level 2 app.
📃 Conclusion
🎉Congratulations! By completing Level 2 of your Teacher Assistant app, you now have a fully interactive, GUI-based classroom companion. You can:
- Manage students with Add, Update, Delete, and View functionalities.
- Track attendance with dynamic checkboxes for each student.
- Record and view grades by class and section.
- Generate visual reports to quickly analyze attendance and academic performance.
- Access teacher information in a clean, structured layout.
Level 2 isn’t just about adding features — it’s about thinking like a GUI developer, managing state, handling dynamic data, and presenting information clearly and interactively.
🎬 Demo Video: Teacher’s Assistant App level 2
Demo of Level 2 Teacher Assistant app – Attendance, Grades, Reports and Teacher Info.
🔜 Next on Techn0tz🚀
Level 3 takes the App even further — multi-teacher support, cloud sync, advanced analytics, and handling multiple classes. Your app is ready to scale!
Stay tuned!!, and get ready to level up your Rust GUI development!